4720
Performant summative 3D rendering of voxel-wise MRF segmentation data1Biomedical Engineering, Case Western Reserve University, Cleveland, OH, United States, 2Interactive Commons, Case Western Reserve University, Cleveland, OH, United States, 3Department of Radiology, School of Medicine, Case Western Reserve University, Cleveland, OH, United States, 4Max Planck Institute for Biological Cybernetics, Tübingen, Germany
Synopsis
Visualization of Magnetic Resonance Fingerprinting segmented data presents significant difficulty because of the abstraction from the usual appearance and contrast of MR images. We present a method of rendering any probability-based tissue fraction partial volume ROIs in three dimensions using additive voxelized volumetric rendering as a form of segmentation. Datasets consist of n groups of segmented maps with each voxel representing the probability of a given tissue converted into 3D textures usable by the GPU to perform raymarched additive rendering. This allows for different tissue classifications within the dataset to be faded in and out with minimal human involvement.
Purpose
Multidimensional segmentation for visualization is a computation and time intensive process. However, recent research in Magnetic Resonance Fingerprinting (MRF) has put emphasis on classifying groups of voxels based on quantitative data collected during the acquisition. Using these “confidence of classification” type maps for 3D segmentation is a logical next step: by using such maps to control a voxel’s opacity (alpha) in a rendering, immediate visualization of different tissues is possible.
Three-dimensional visualizations of data have value due to the ability to look beyond a single plane within an acquired dataset. When combined with the ability to control the opacity of different groups of tissues, such visualizations gain even more diagnostic and educational relevance. We aim to provide radiologists and surgeons the ability to rapidly identify the general location and size of a pathology in an intuitive way without increasing the amount of manual segmentation or ROI generation required.
Methods
MRF segmented data are generated from MRF acquisitions using an automated classification technique – here, we tested the system using data created via dictionary-based segmentation [1], Multicomponent Bayesian Estimation[2], and Independent Component Analysis (ICA) [3]. Each classification methodology outputs maps containing normalized percent contributions of a specific classification, with the sum of all maps corresponding from a single voxel equaling one.
Each map’s slices are processed to generate a 2D Texture Array used for voxel lookups on the GPU. These arrays each represent one tissue classification type. A base color and linear weighting factor are assigned to each 2D Texture Array, then all texture arrays are combined into a master 3D Color Texture as well as a master 3D Gradient texture containing calculated local gradient data. Together, these 3D textures allow for shaded and colored renderings of the MR datasets.
The user controls the component rendering weights, allowing modification of each segmentation's opacity. This allows the user to fade in and fade out different regions and tissues in the image in near real-time.The user also controls the color assigned to each segment, letting them place emphasis on regions they want to demonstrate to a peer, or serving as a reminder about a problematic area.
Rendering is performed with an optimized raymarching system created for efficiency on mobile processors.[4] Because the additive rendering approach generates visualizations that approximate surfaces within the dataset, modifications were made to the renderer to enable Phong lighting[5] to give the user the ability to add shadow and improve surface contrast dynamically. Lighting position, color, and intensity are all variable in real time.
Results
The renderer was performant on both desktop computers and high end mobile hardware, with adequate framerates possible on even commodity smartphones (Samsung Galaxy S9+). Effective visualizations were generated for all three tested segmentation approaches. All datasets were collected with matrix size 235x256x120, with 1.2mm isotropic voxels.
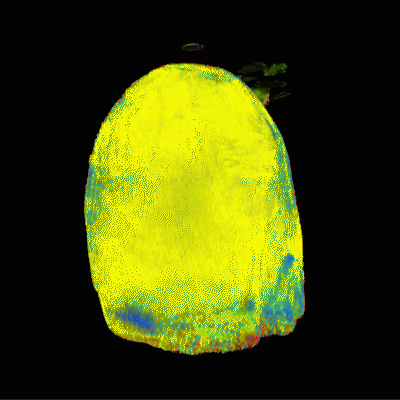
The segmentation that most closely matches traditional tissue classifications is generated with the dictionary-based segmentation. However, this approach requires the most human intervention during the segmentation process because the user must draw and define ROIs for each desired tissue type. Since the dictionary-based segmentations had predefined tissue types for white matter, grey matter, fat, and CSF, the datasets from the dictionary-based segmentations were easy to understand and interpret. A rendering of the dictionary-based approach is shown in Figure 1.
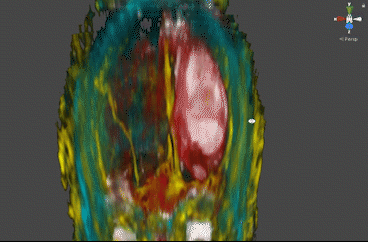
The Bayesian approach created clear benefits in the form of direct visualization of pathology: thanks to its sensitivity to local groups of tissues, this approach created maps that directly visualize a peritumoral mass and the surrounding vasculature.
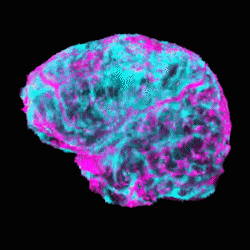
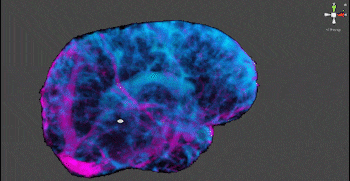
These segmentations required no human input, and create clear visualization of the scale and location of the tumor. The ICA approach generated maps that similarly visualized structures with clear component distinction that would not be evident or separable without more involved classical segmentation and polygonization – notably, CSF and vasculature are visible in Figures 3 and 4.
Discussion
Rapid visualization of specific three dimensional tissue structures without extensive human intervention would be a significant advance in MR, as it could potentially increase our ability to communicate 3D information about disease. This work demonstrates that emerging MRF-based tissue classification techniques, when combined with rendering approaches that leverage voxel-specific characteristics like opacity, are beginning to produce maps that can be used for useful unsupervised segmentation without reliance on deep learning techniques. Such classifications and visualizations promise to be robust and extensible. Moreover, as the rendering approach described is additive, all of the mentioned segmentation approaches can be used constructively to create custom segmentations and visualizations that are highly specific. Because these processing and rendering steps don’t require any specialized hardware, we believe that these methods could impact a wide range of diagnostic situations in MRI.Acknowledgements
Siemens Healthcare, R01EB018108, NSF 1563805, R01DK098503, and R01HL094557.References
[1] Deshmane, A., McGivney, D., Badve, C., Gulani, V. and Griswold, M.A.(2016), Dictionary approach to partial volume estimation with MR Fingerprinting: Validation and application to brain tumor segmentation. ISMRM 2016: 132.
[2] McGivney, D. , Deshmane, A. , Jiang, Y. , Ma, D. , Badve, C. , Sloan, A. , Gulani, V. and Griswold, M.A. (2018), Bayesian estimation of multicomponent relaxation parameters in magnetic resonance fingerprinting. Magn. Reson. Med, 80: 159-170. doi:10.1002/mrm.27017
[3] Boyacioglu, R., Ma, D., McGivney, D., Onyewadume, L., Kilinc, O., Badve, C., Gulani, V., and Griswold, M.A. (2017). Dictionary free anatomical segmentation of Magnetic Resonance Fingerprinting brain data with Independent Component Analysis. ISMRM 2017.
[4] Dupuis, A., Franson, D., Jiang, Y., Mlakar, J., Eastman, H., Gulani, V., Seiberlich, N., and Griswold, M.A. (2017). Collaborative volumetric magnetic resonance image rendering on consumer-grade devices. ISMRM 2017.
[5] Phong, B. (1975). Illumination for Computer Generated Pictures. Comm. ACM., 18. 6. 311-318.
Figures


